Resultados Elecciones Autonómicas en Castellar
|
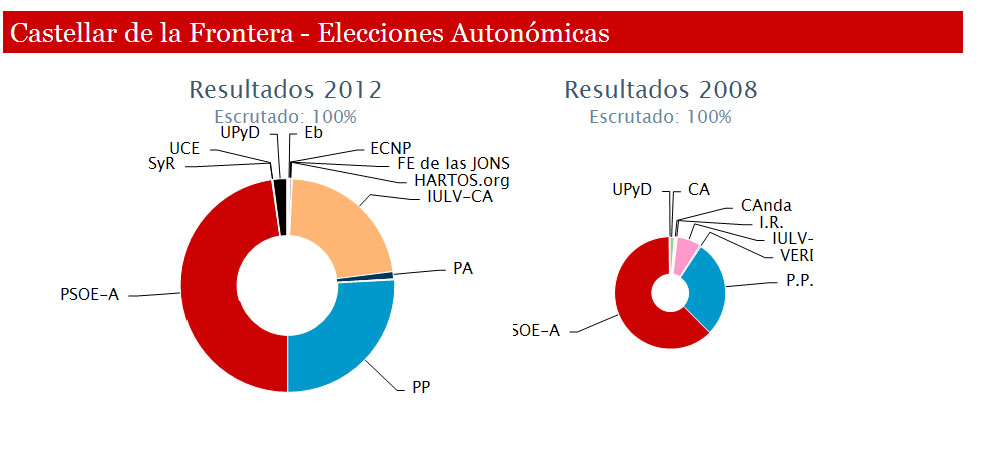
RESULTADOS 2012 | |||
|
Partido |
Escaños |
% votos |
nº votos |
|
PSOE-A |
|
47,34% |
712 |
|
PP |
|
25,66% |
386 |
|
IULV-CA |
|
22,00% |
331 |
|
UPyD |
|
2,06% |
31 |
|
PA |
|
1,13% |
17 |
|
HARTOS.org |
|
0,26% |
4 |
|
EQUO |
|
0,19% |
3 |
|
ECNP |
|
0,13% |
2 |
|
PACMA |
|
0,13% |
2 |
|
SyR |
|
0,13% |
2 |
|
Eb |
|
0,06% |
1 |
|
FE de las JONS |
|
0,06% |
1 |
|
UCE |
|
0,06% |
1 |
|
Escrutado 100% | |||
|
RESULTADOS 2008 | |||
|
Partido |
Escaños |
% votos |
nº votos |
|
PSOE-A |
|
61,75% |
1.075 |
|
P.P. |
|
27,97% |
487 |
|
IULV-CA |
|
7,01% |
122 |
|
CA |
|
1,26% |
22 |
|
CAnda |
|
0,46% |
8 |
|
VERDES |
|
0,34% |
6 |
|
I.R. |
|
0,17% |
3 |
|
UPyD |
|
0,17% |
3 |
|
Escrutado 100% | |||
|
ESTADÍSTICAS | ||||
|
|
2012 |
2008 | ||
|
PARTICIPACIÓN FINAL: |
1.524 votos |
66,12% |
1.764 votos |
79,50% |
|
PARTICIPACIÓN PRIMER AVANCE: |
- votos |
0% |
- votos |
0% |
|
PARTICIPACIÓN SEGUNDO AVANCE: |
- votos |
0% |
- votos |
0% |
|
VOTOS EN BLANCO: |
11 votos |
0,73% |
15 votos |
0,86% |
|
VOTOS NULOS: |
20 votos |
1,31% |
23 votos |
1,30% |
- Creado el .